01 · The starting point
Product StrategyRapid Prototyping
Design started at zero
refinq had validated climate models, existing research and several valid product directions.
Development had not started, because the funding decision had to come first.
No product design, no wireframes, no screens, no design system.
I was the only designer.
The prototype therefore had two jobs.
It had to make the proposed product concrete in the funding room. It also had to leave behind a structure the future team could develop.
The main constraint was scope.
Six directions could not become six products in four months. A clear first product had to be defined without closing the door on later use cases.
The product design had to be specific enough to fund and broad enough to grow.
02 · Product strategy
Information ArchitectureStakeholder Alignment
Challenge: Six directions → one product
What did the six directions actually have in common?
The founders’ ideas ranged from supply chains to scenario planning.
All of them were valid, but we had to set priorities in order to create an MVP.
What every direction shared was a starting point: company location.
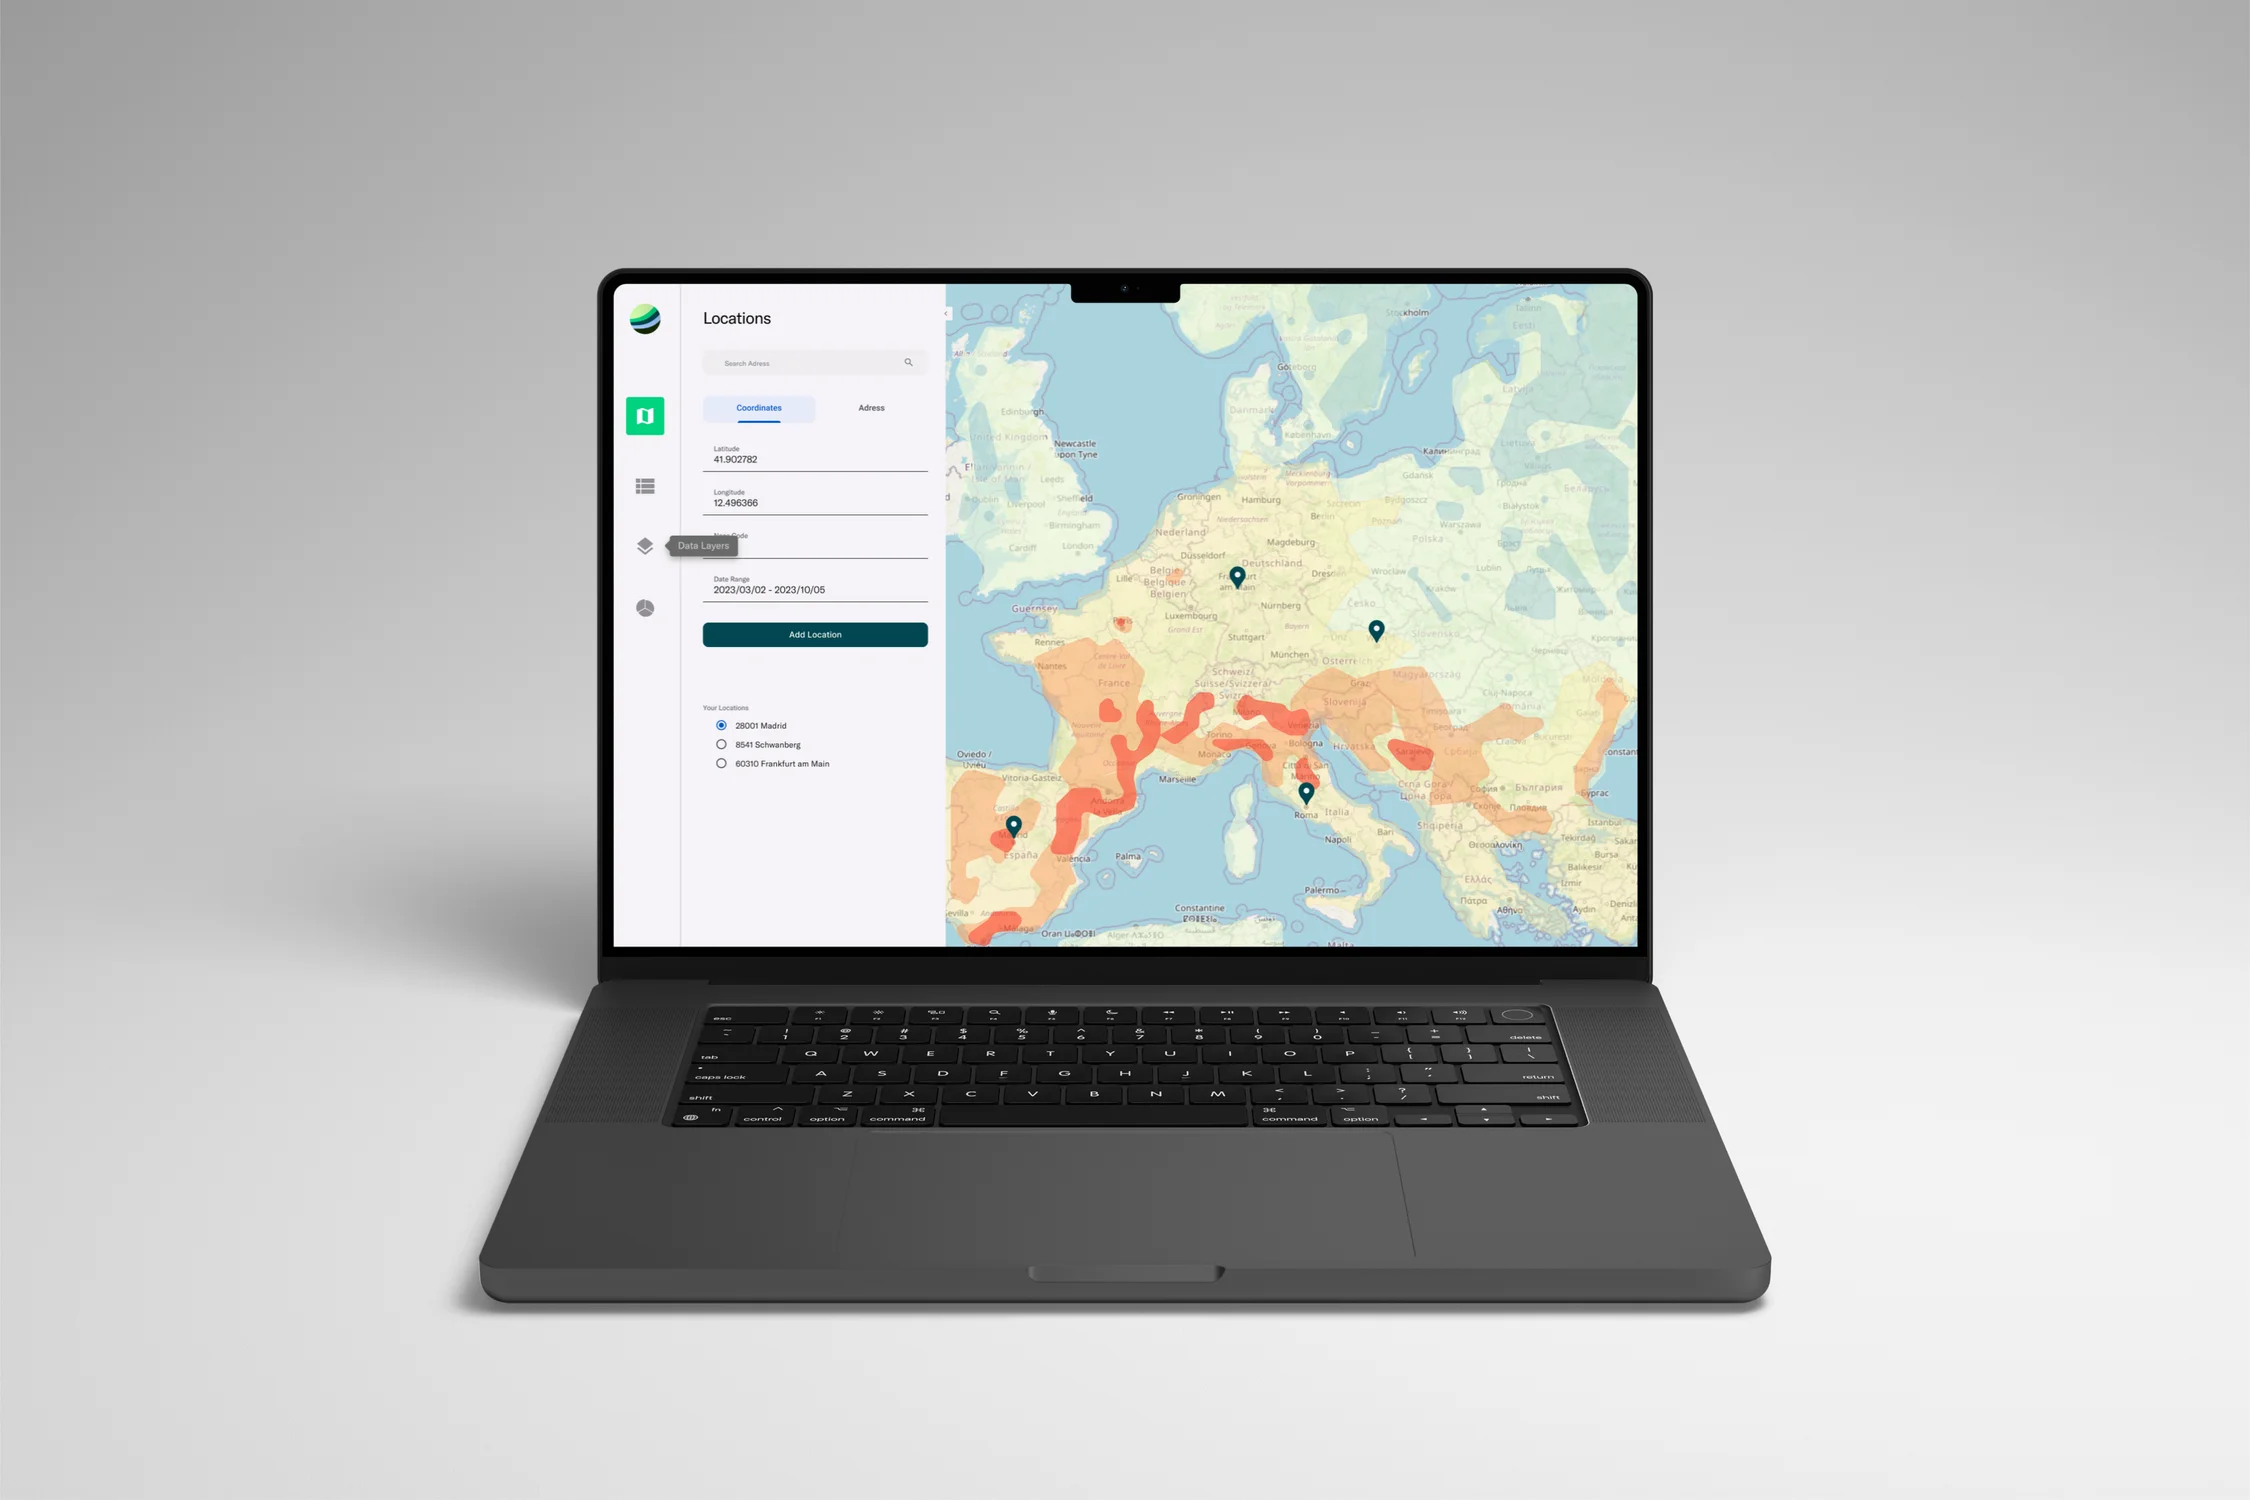
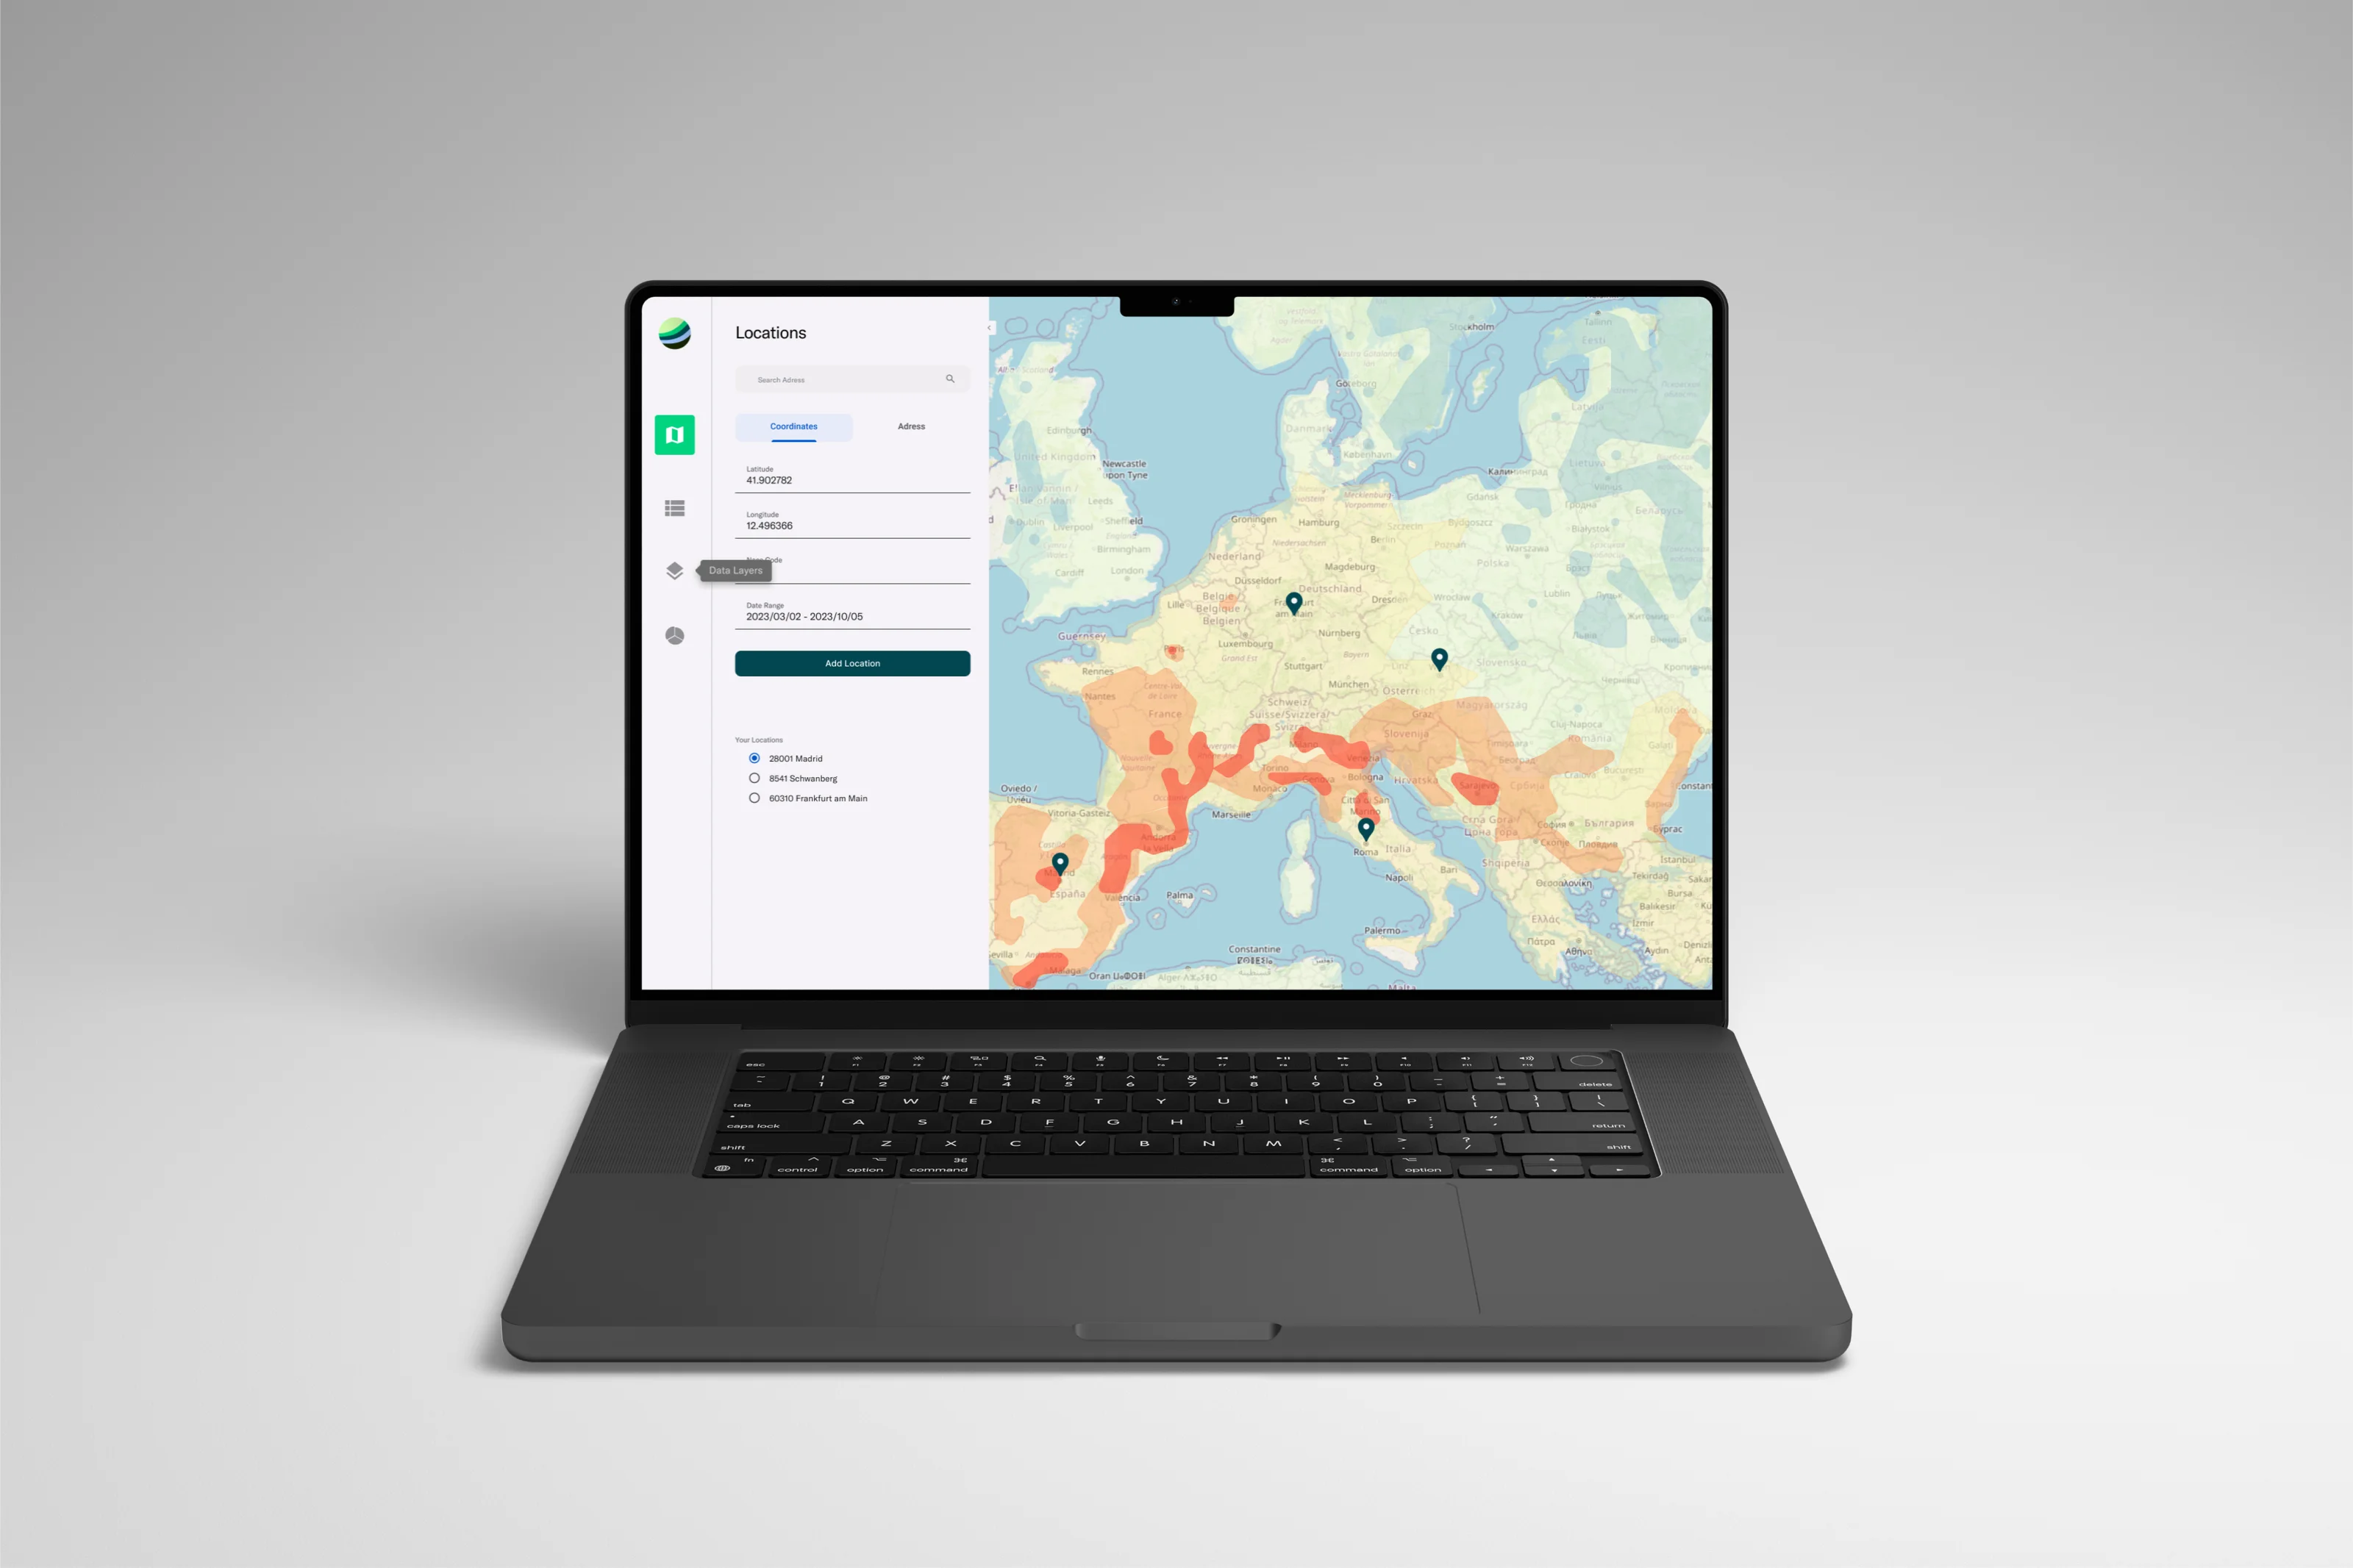
That decision created four connected areas: map, locations, risk and financial impact.
It also created one complete journey: sign in, add a location, understand the risk, compare the financial effect, and export a report.
Instead of comparing six futures in the abstract, the founders worked through one product they could see, and each direction either found its place in it or moved to later.
Six directions became one journey without removing the future options.
03 · Interaction and data visualisation
Interaction DesignData Visualisation
Decision-makers need the conclusion first. Specialists need the evidence behind it.
The product had to support two levels of use.
Specialists needed traceable climate data, models and scenarios.
Corporate decision-makers needed a clear answer at portfolio level.
I built every screen around one rule: show the answer first, keep the evidence one interaction away.
A risk score appears in the main view.
The scenario matrix, source and model details can be opened when they are needed.
The journey ends in financial impact, which translates hazard data into an interactive report that supports business decisions.
A single unexplained summary score was avoided.
In climate risk, a number that cannot be traced is not useful.
The interface reduced complexity without hiding where the result came from.
Station 1 · Sign in. Click Login to start the journey.Station 2 · Map. Decision 1 · two tabs, Coordinates and Address, plus NACE code and reporting period.Station 3 · Location Details. Decision 2 · the score up front in a coloured chip, source and model open on demand.Station 4 · Data Layers. Risk is a layer you switch: heat stress, flood, Natura 2000.Station 5 · Report. Decision 3 · two risk types, one euro figure each, the bigger risk as the bigger circle.



04 · Design foundation
Design SystemsAccessibility
The design foundation was built at the same time as the product.
Material Design 3 provided the base. I extended it with the patterns refinq needed: severity chips, scenario matrix, financial impact visualisations and ESRS reporting table.
Each component included its states and its information logic, not only a default screen. Severity was communicated through colour, label and score, so it remained readable in greyscale and for people with colour vision differences.
The library was documented so engineering could start from a defined product structure instead of reverse-engineering it.
The prototype showed what to build. The foundation showed how to continue.

The chip carries the answer. The modal carries the method: definition, data sources, scoring, the same pattern behind the info dot on every hazard row.
Colour + label + score, all three, always. Readable without colour: flip the Greyscale toggle.
Heat stress results from unusually hot weather. When air temperatures and/or humidity are high, the body's core temperature rises, and the heart rate increases. This risk has a granularity of 0.083° x 0.083°. Historical extreme temperature events were evaluated with the expected heat-related production decline, which is related to the maximum temperature of the respective region.
Data Sources:
The assessment of heat stress risk is based on a historical heat map from the World Bank, which measures a 100-year heat event and indicates the historical Wet Bulb Globe Temperature (WBGT) in °C. This historical heat map was then stress-tested for temperature changes, assuming a 1:1 correlation. This data was sourced from the Climate-Impact-Explorer.
Scoring:
To score the risk, the maximum value from the resulting time series is determined over the duration of the asset. The thresholds are based on a temperature categorization by the US Military, detailed in the publication "Development of a hazard screening protocol for Extreme Heat."
05 · Outcome
Company OutcomeProduct Handover
The founders could show one product instead of explaining six ideas.
The interactive prototype was used in refinq’s FFG funding presentation. refinq subsequently received €480,000 in research funding from the Austrian Research Promotion Agency FFG.
My contribution was a complete product direction and a documented design basis. I made the intended product visible, testable and concrete enough to be discussed as a product.
The founders could align around one interactive product rather than separate descriptions. Engineering could begin with a defined journey, data hierarchy and documented components.
After handover, the team continued with the location-based journey, the risk scale, the scenario logic, the financial impact visualisation and the design foundation.
06 · My contribution
More projects
What else I have built.
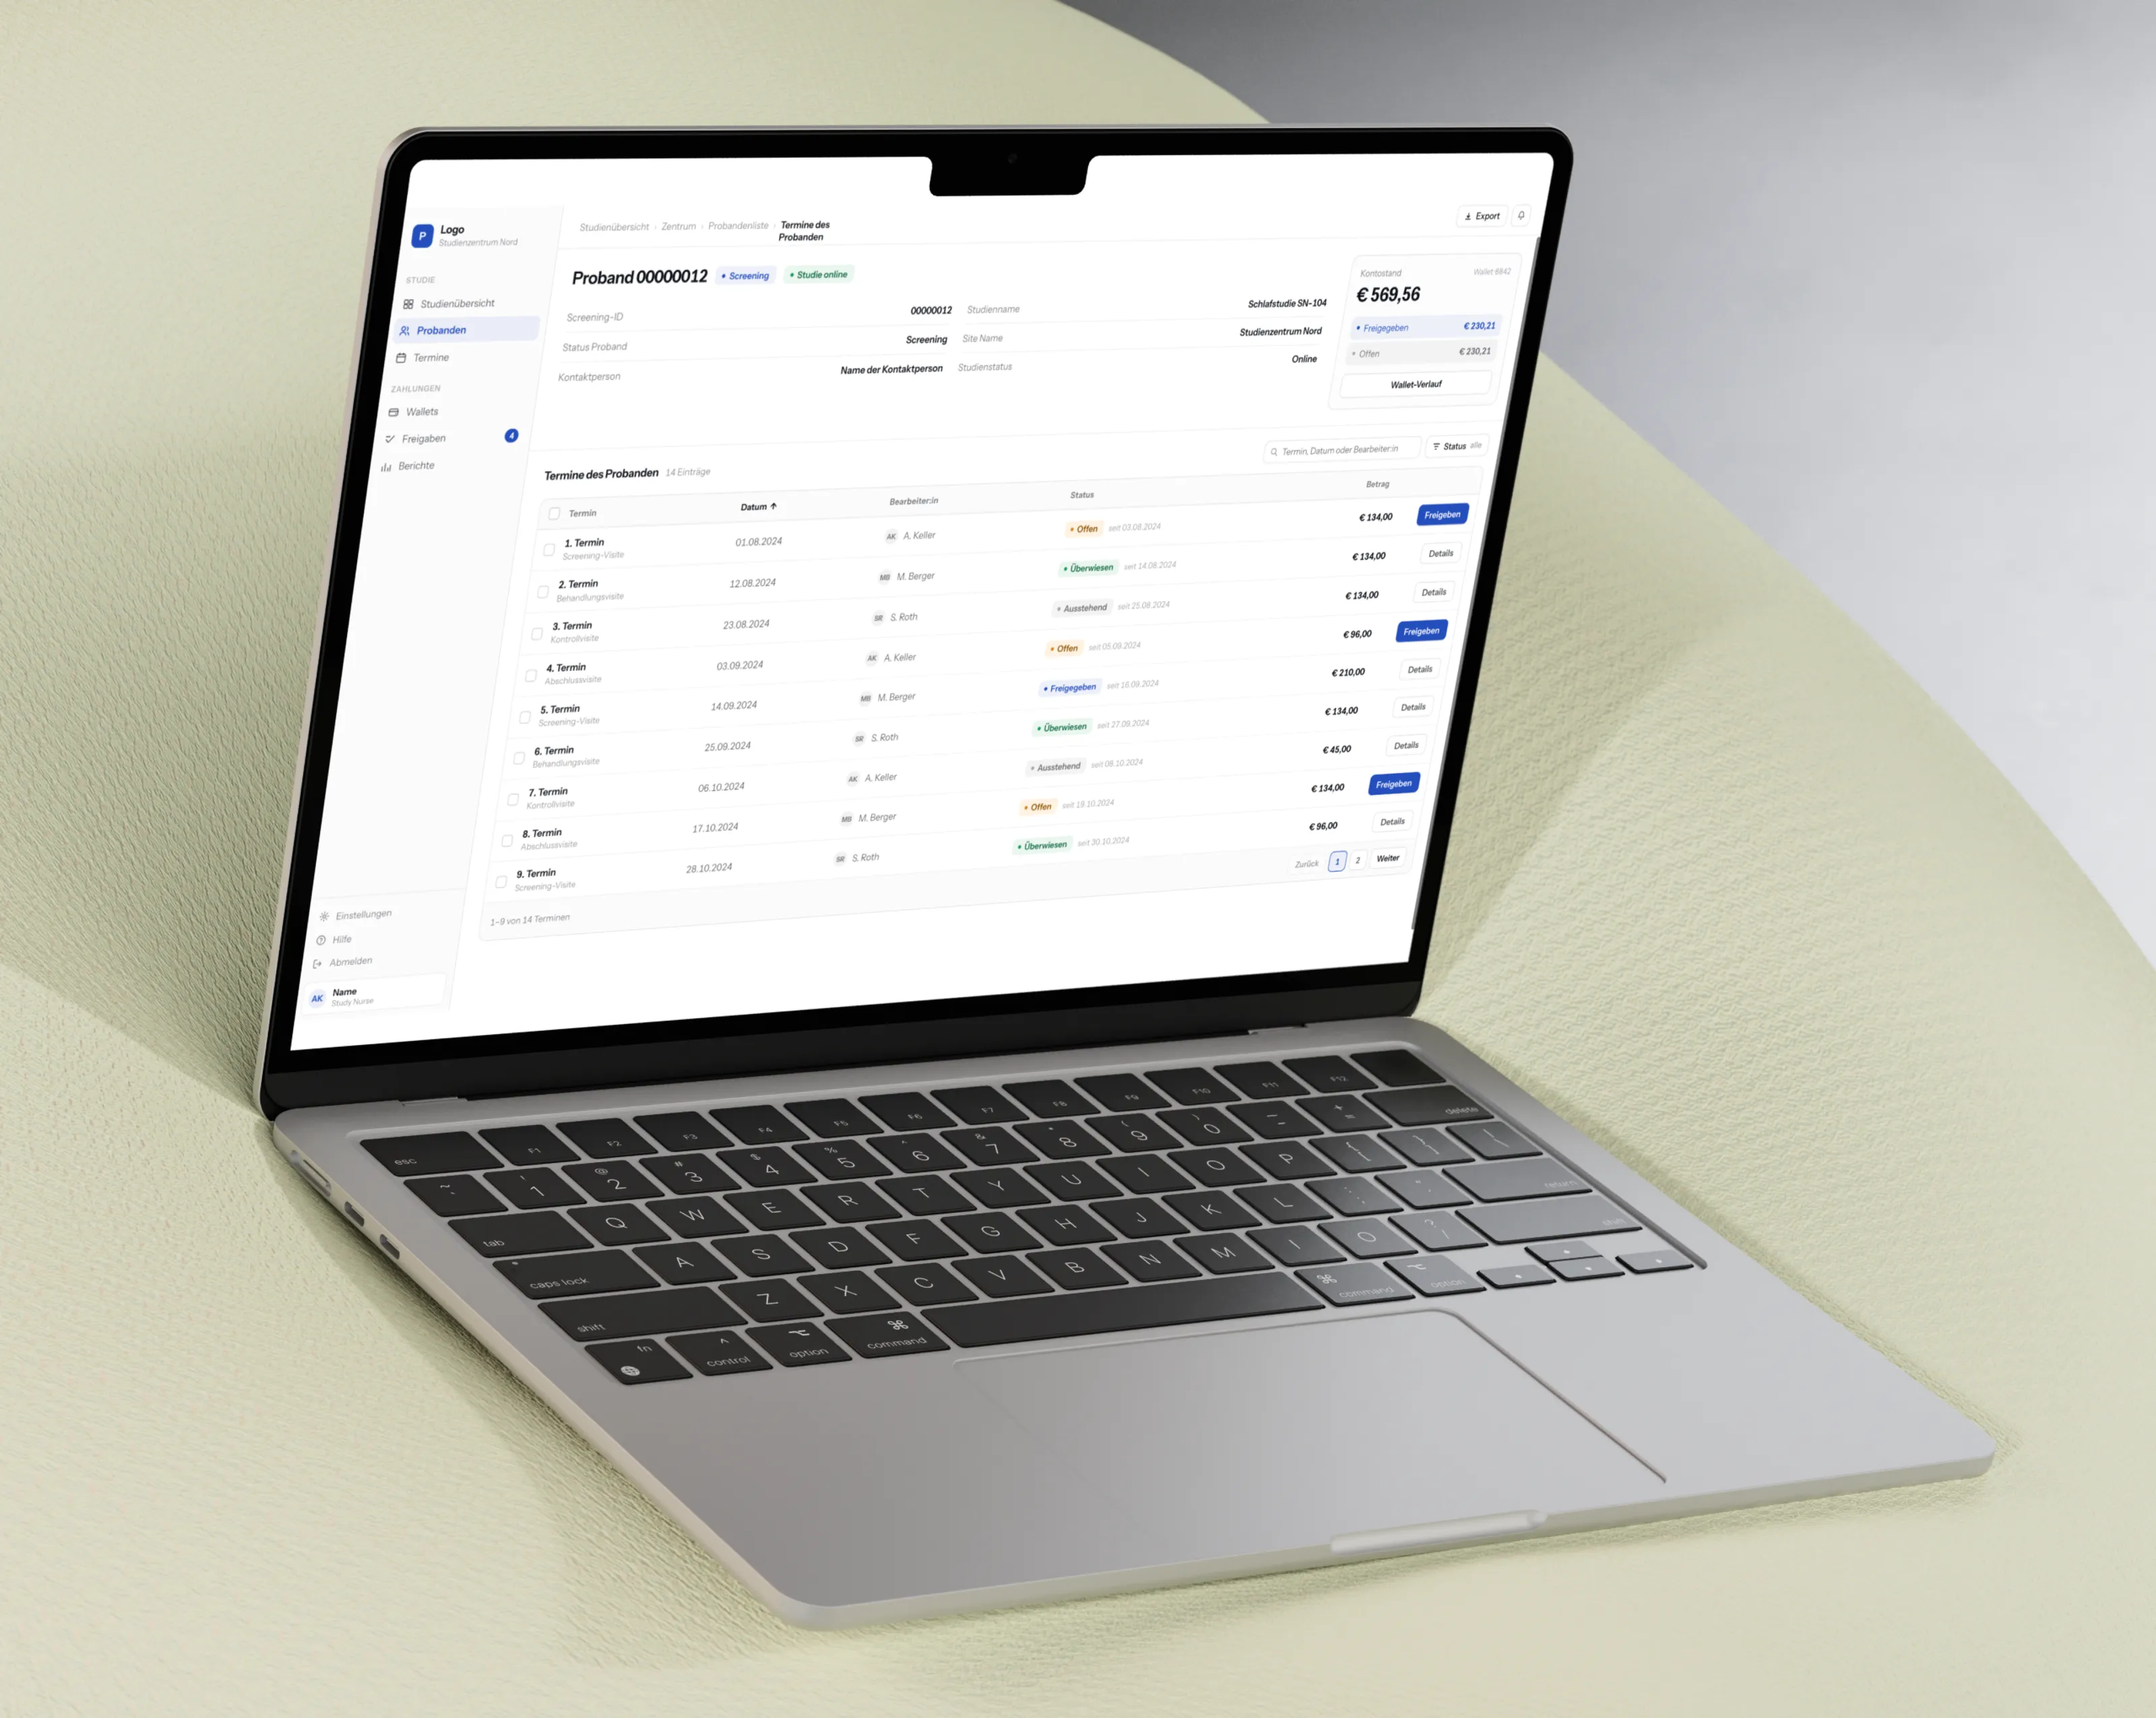 ProbandoOne startup, four projects, one bottleneck.I improved the internal dashboard and public website, rebuilt the design foundation they exposed as a delivery problem, and then designed their payment system from zero.
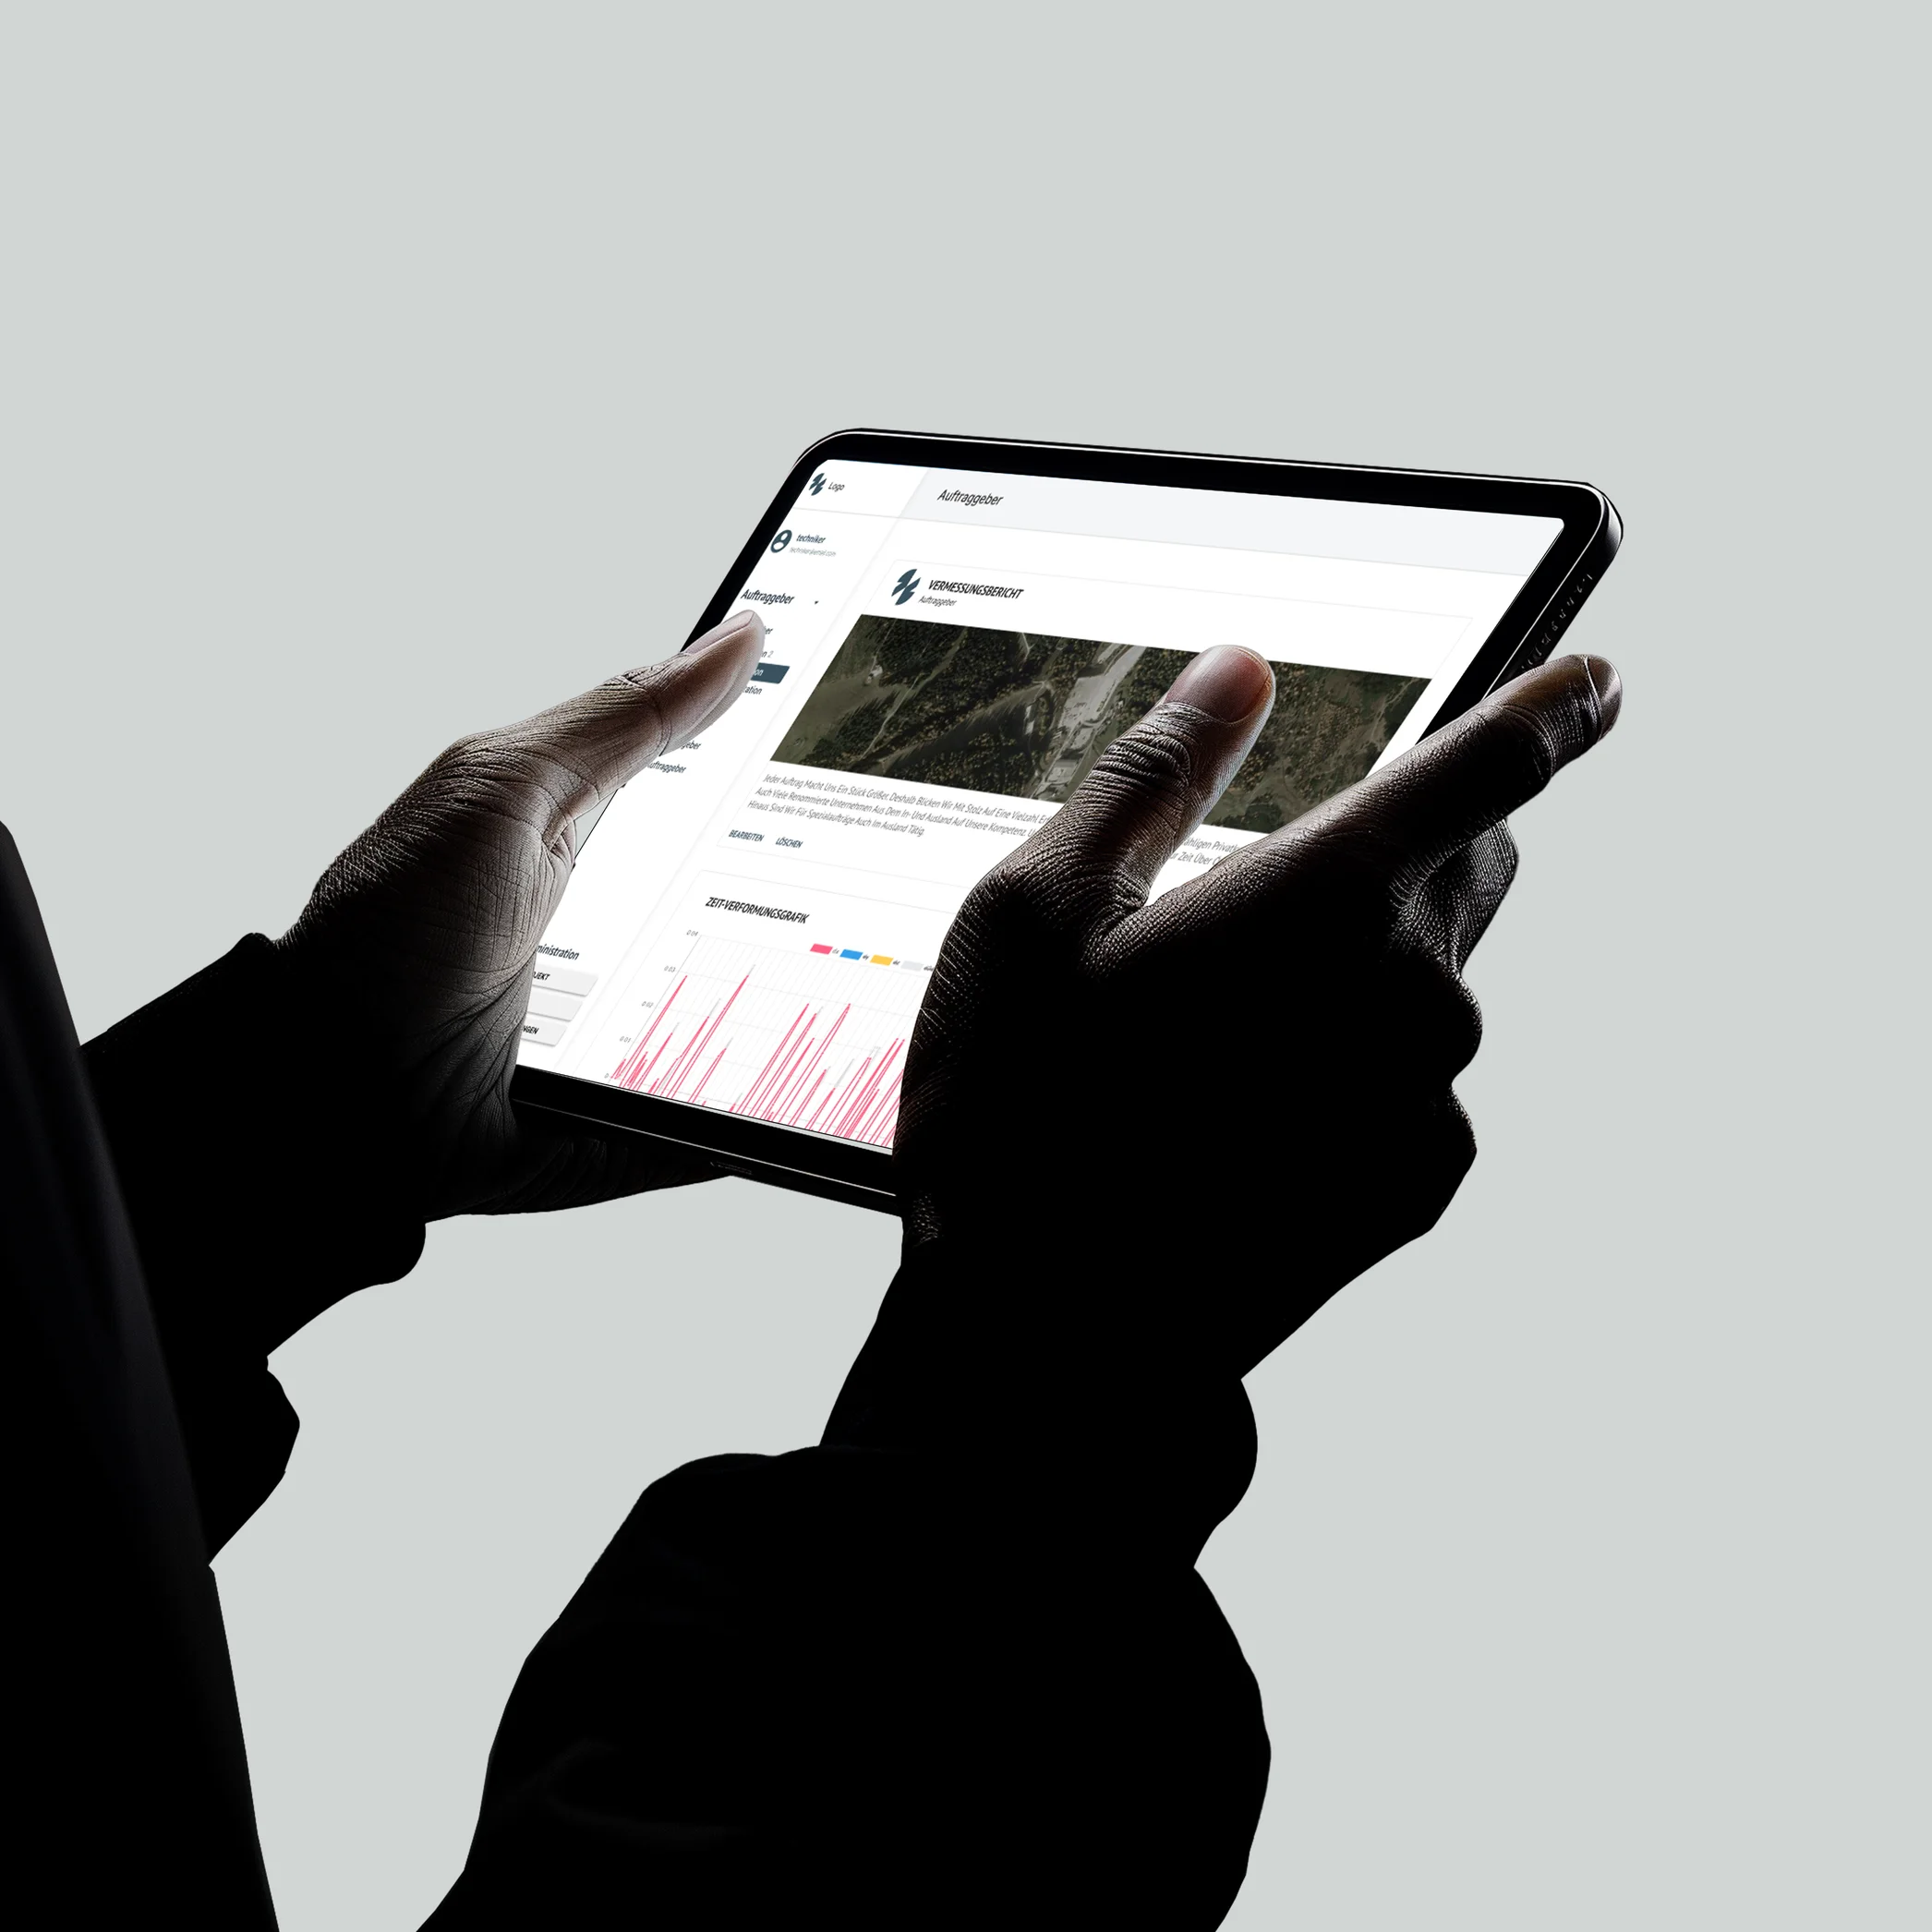
 TrigonosDecades of geodata, one decision interface.I designed a geomonitoring system from zero for field engineers, analysis teams and clients. It has been in daily use since 2021.
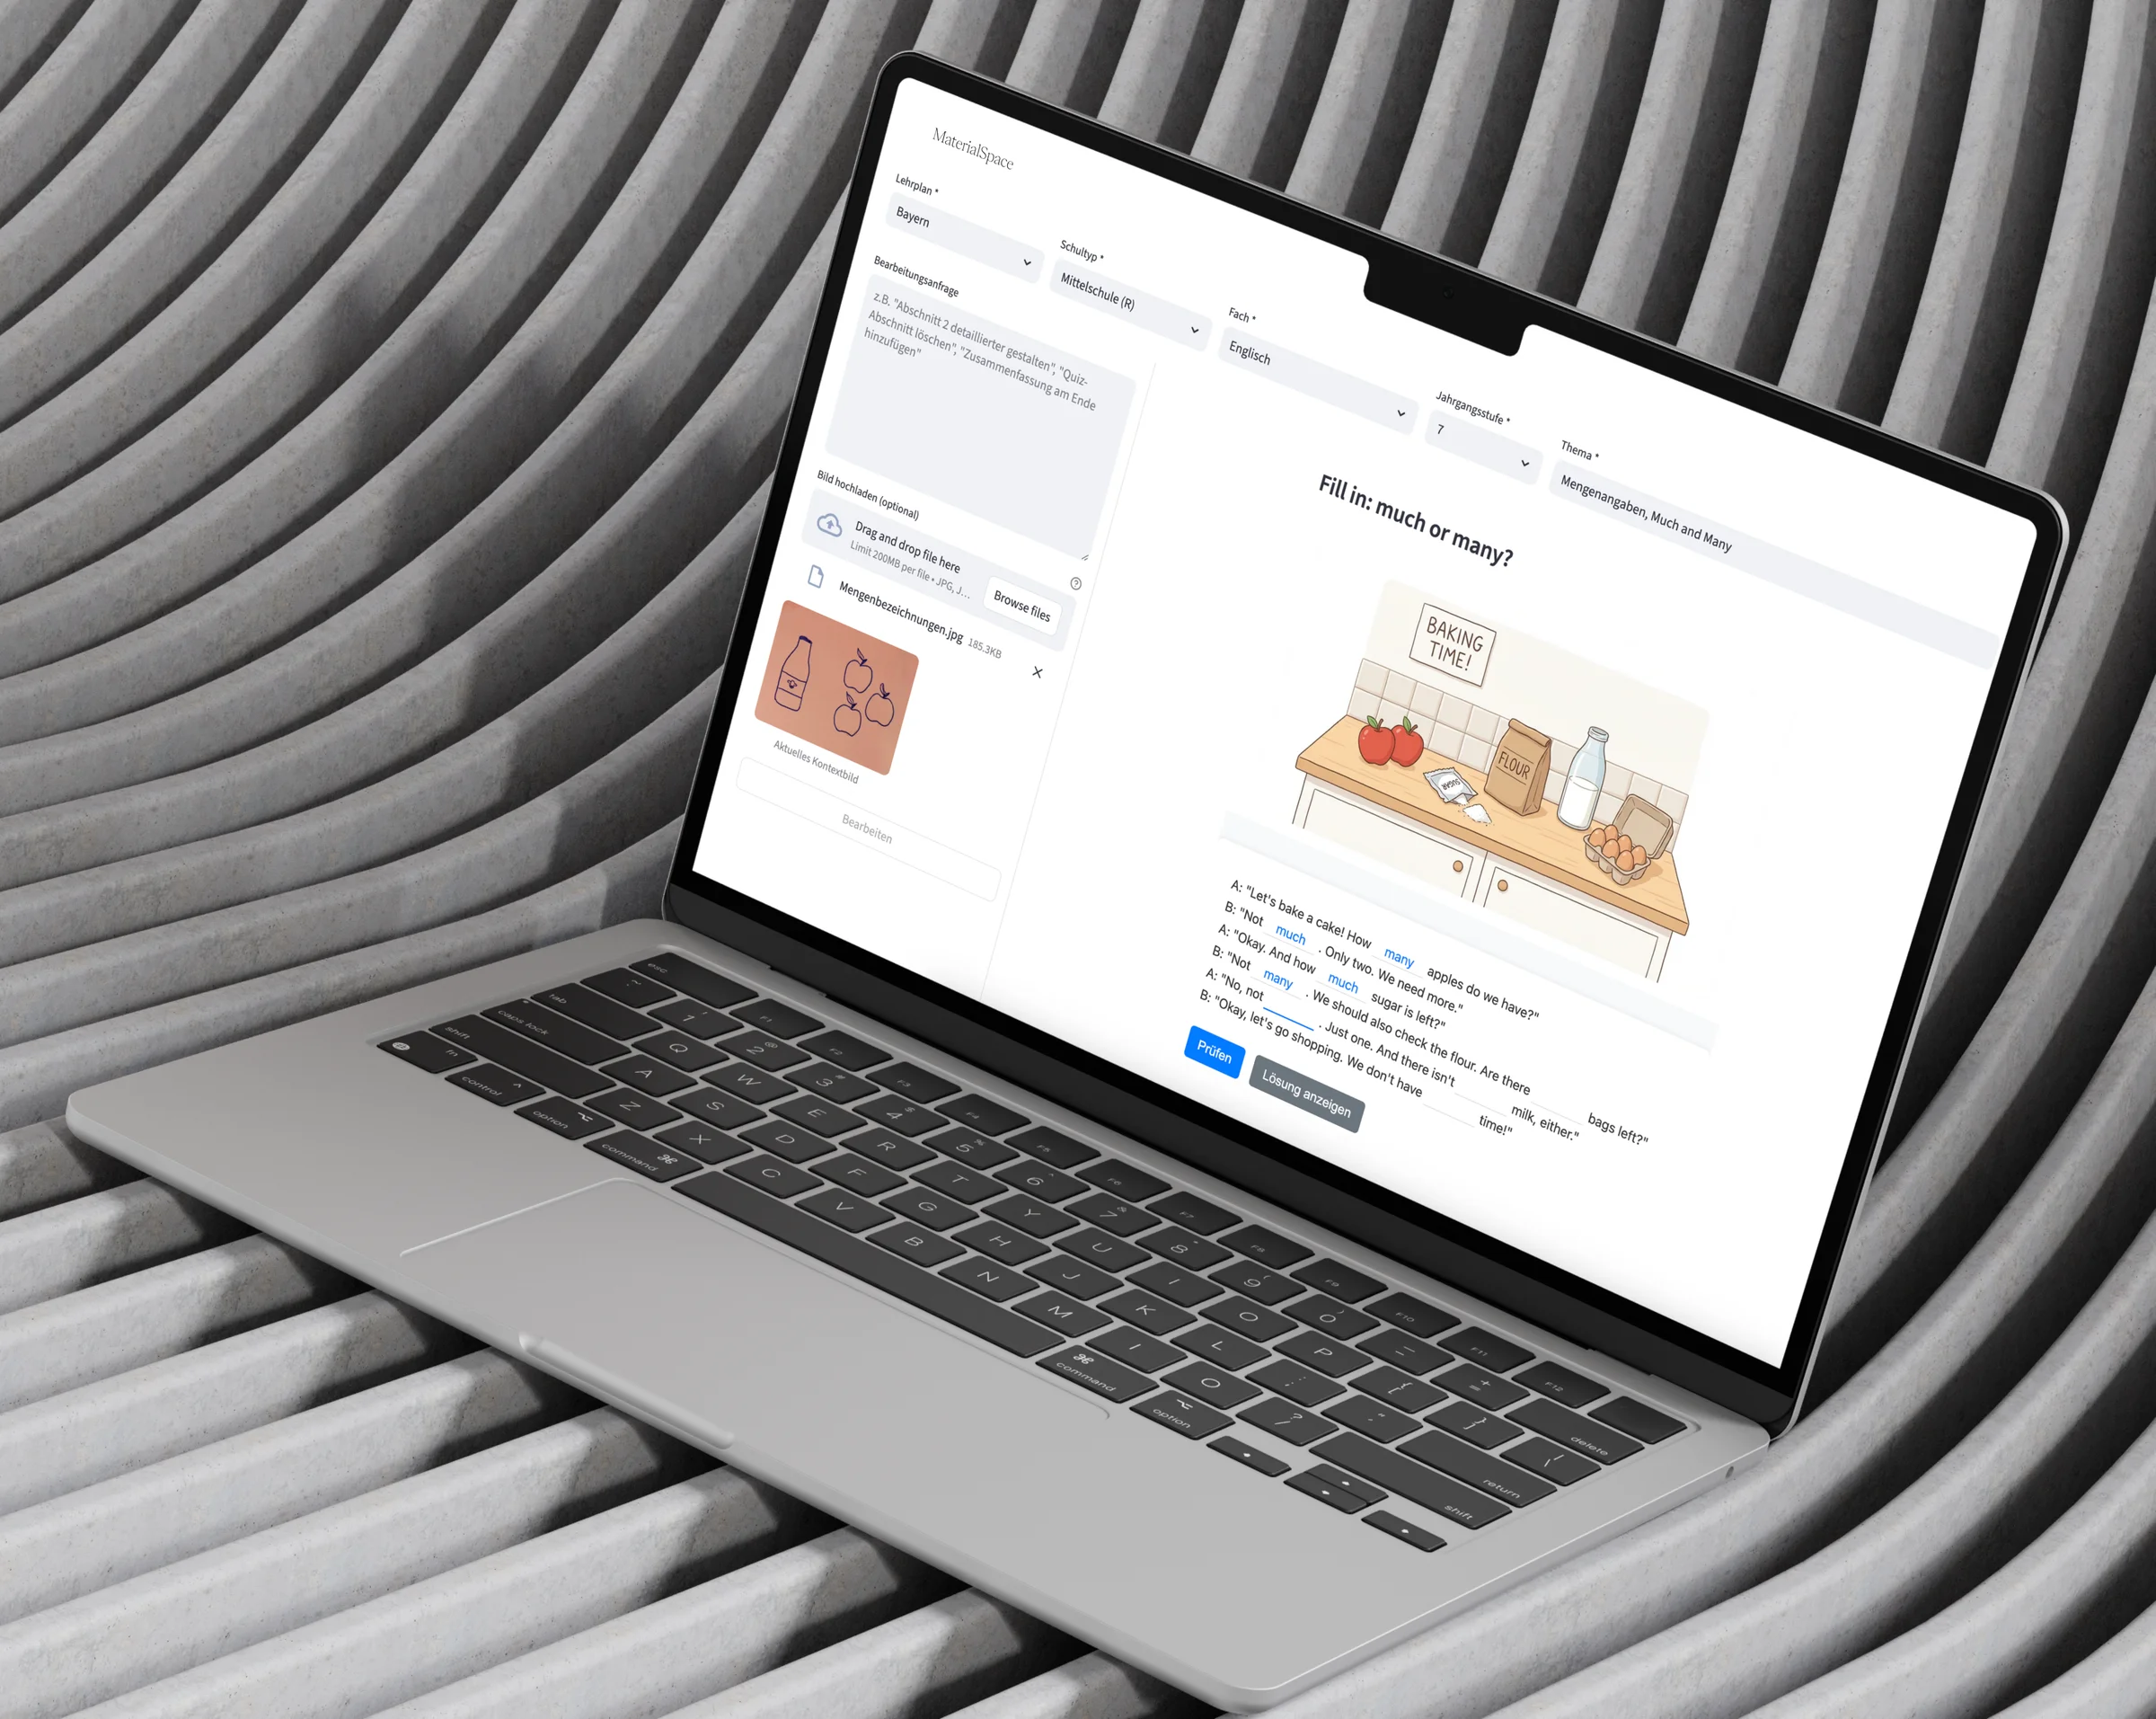
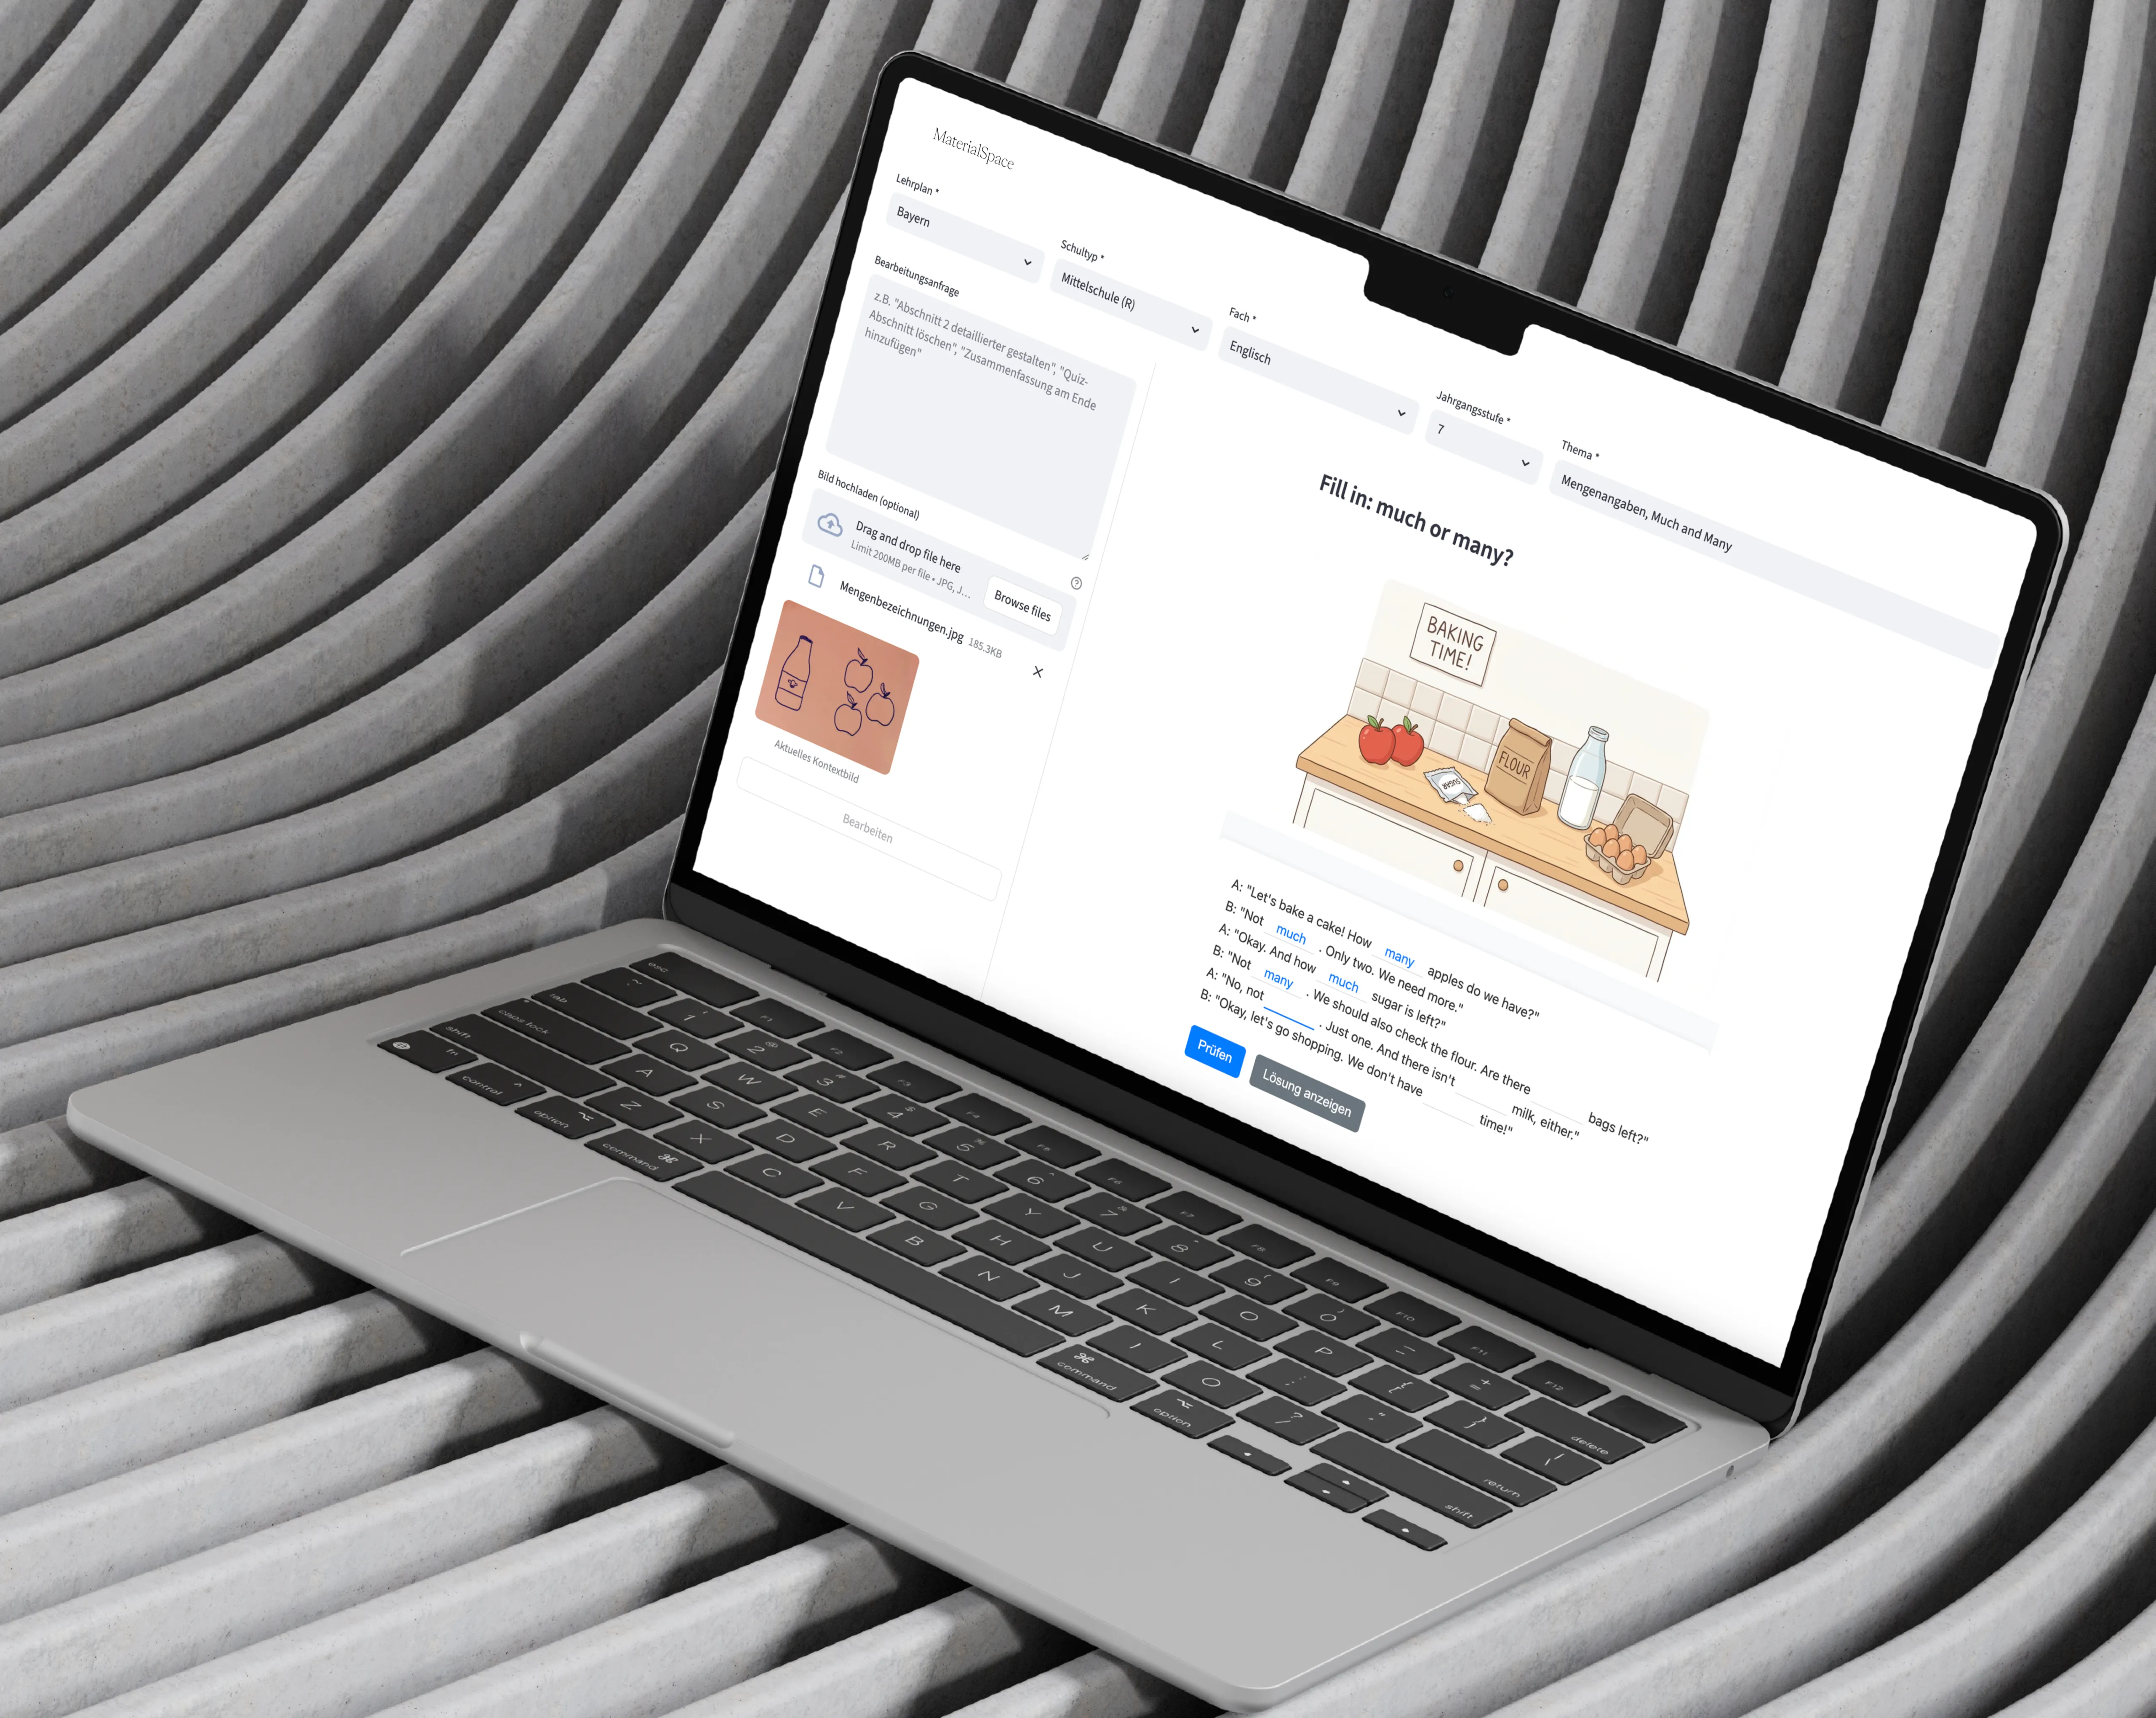 MaterialSpaceTrust decides whether an AI product gets used.I replaced prompting with structured interaction and validated the approach with 60 participants.